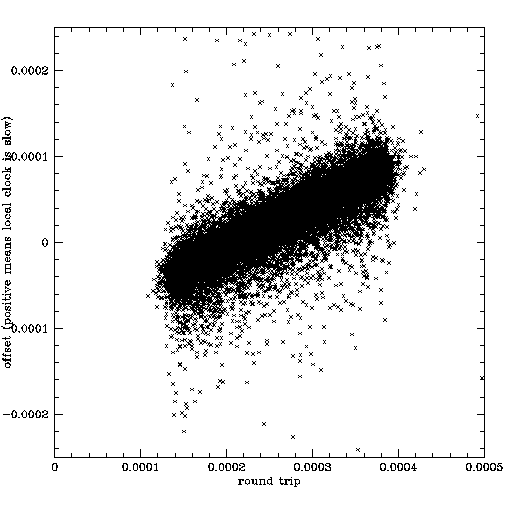

This is the scatter plot from one of my ntp clients to a GPS PPS server with a Gigabit Intel ethernet card. Note that the slope of the correlation between the round trip and offset is about 1/2 with positive slope (the greater the round trip time, the slower the clock on the client seems to be). Ie the change in roundtrip seems to occur on the return trip from the server, not in the outward trip which seems to be constant.
what is strange is that the distribution in round trip is
essentially a square function-- ie the probability of a givem
round trip value is equal for any value between .14ms to .40ms
and essentially zero outside that range.
The distribution of offsets is essentially gaussian at
any value of roundtrip.

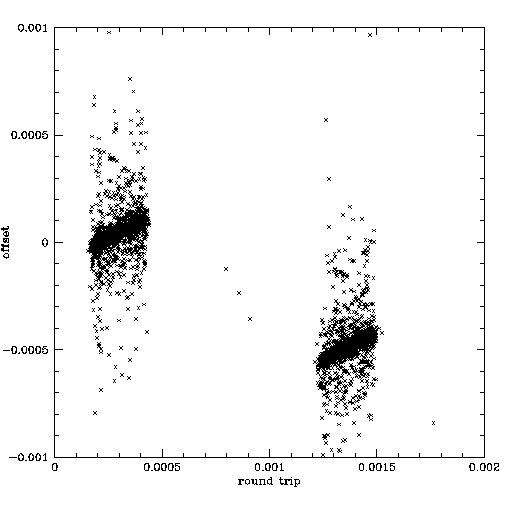
This is the scatter plot from another ntp client to the same server. Note that the form of each of the clusters is the same as in the previous case, but the two clusters are separated by a slope of -1/2 -- ie for the cluster with the larger round trip, the local clock seems to be faster than the server. The delay seems to be perfectly asymmetric in both cases, but the asymmetry is opposite within the clusters than it is between clusters.

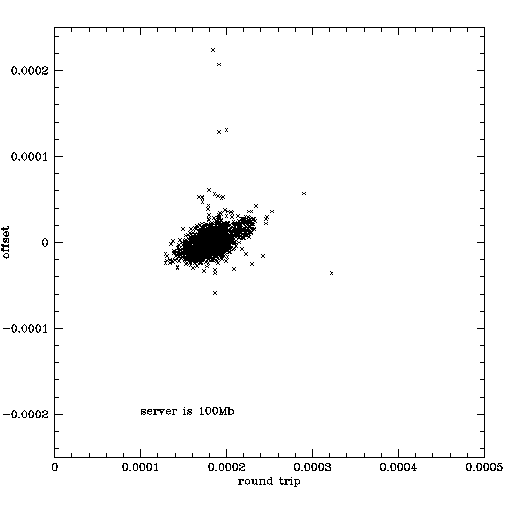
This is the scatter plot from a client ( as in the first case) but this time to a GPS PPS server with a 100Mb Intel ethernet card. All clients are on the same Cisco ethernet switch. All clients have 100Mb cards, although a client with a Gb card seems to have essentially the same behaviour.
That the third plot to the 100Mb server has a much smaller round trip distribution suggests that this is not a problem with the switch.
After the above was done, I discovered that the Gb card on the server was actually runnning at 100Mbps with interrupt coalescence switched on. In this web page the result of switching the card to 1000 Mbps and then switching off interrupt coalescing is plotted.